TrailMine
A blockchain analytics workspace for tracing Ethereum and Bitcoin transactions, uncovering patterns, and exploring on-chain activity.
A workspace for following the money
TrailMine brings blockchain transaction history into an interactive investigation workflow. A user can start with a wallet, inspect its transfers, narrow the data, and follow the relationships that emerge. The project combines a Streamlit dashboard for EVM activity with a separate Bitcoin ingestion and graph-analysis path.
The central design goal is to make a transaction trail readable at several levels. A table preserves the individual records. Frequency and volume views reveal patterns across those records. A graph connects the addresses involved. Moving between those views helps an investigator relate a broad pattern to the transfers behind it.
Fetching and normalizing wallet history
The EVM dashboard retrieves wallet history through Moralis, with network handling for Ethereum and Polygon. Its request loop follows the API cursor to collect multiple pages, stopping when there is no further cursor. Streamlit caches the query result so repeated exploration can reuse the fetched data.
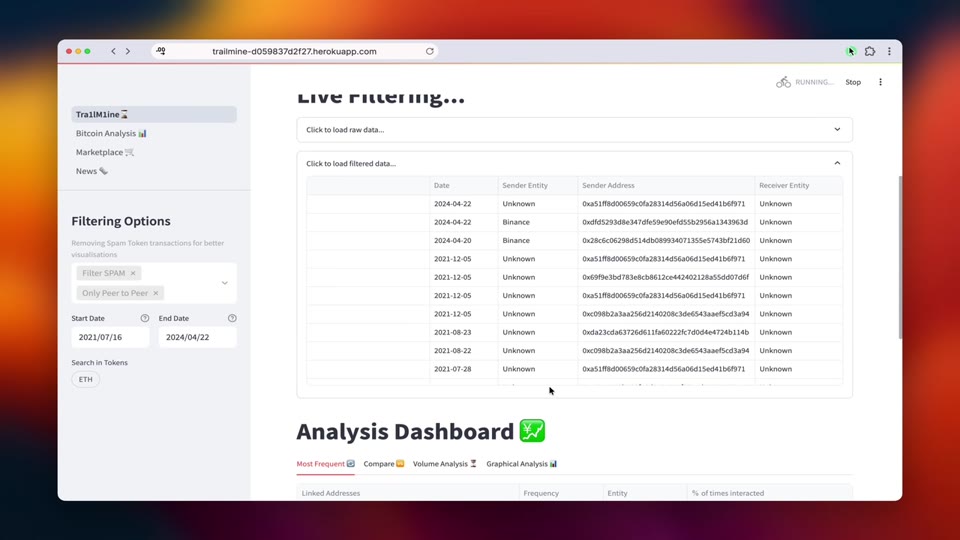
The normalization layer turns the response into Pandas dataframes with consistent fields for addresses, entity labels, timestamps, token names, values, and transfer direction. This shared representation is what lets the table, charts, and graph describe the same activity. Raw and filtered tables remain available in expandable sections for inspection.
Narrowing the trail without losing the record
The filtering workflow focuses the dataset on peer-to-peer transfer records and removes unwanted token activity through transaction-summary rules. Date controls narrow the time window, and token selection scopes the volume-analysis views. The resulting dataframe becomes the input for the rest of the dashboard.
The transaction table includes sender and receiver entities, addresses, direction, and formatted value. Each transaction hash links out to Blockscan, so an investigator can open the underlying record while continuing to work inside the analysis workspace. That link between a cleaned dataset and a specific explorer record keeps the visual summaries grounded.
Four ways to read the same activity
The analysis dashboard is organized into Most Frequent, Compare, Volume Analysis, and Graphical Analysis. The frequency view ranks connected addresses and adds entity labels where they are available. The comparison view fetches two wallets on the same network and plots sent and received transaction counts over time.
Volume Analysis separates incoming and outgoing activity and lets the user choose which fields drive the charts. The graph view builds address nodes and directed transfer edges from the filtered dataframe. Known entities receive a different color from unknown addresses, and a top-100-rows control keeps the initial graph manageable.
- Rank recurring counterparties and inspect their share of the activity.
- Compare two wallets through date-based transaction charts.
- Explore incoming and outgoing token flows independently.
- Follow directed address relationships in an interactive graph.
A separate ingestion path for Bitcoin
The Bitcoin worker subscribes to unconfirmed transaction events over a WebSocket connection. It extracts input and output addresses, transaction amounts, timestamps, and transaction hashes, then prepares those values for a Neo4j import. BTC amounts are also paired with a price lookup to produce USD-valued fields.
Its flow calculation excludes outputs returning to an input address when calculating the amount moving onward. The code also includes connection checks before ingestion and a reconnect path for WebSocket errors. The Bitcoin dashboard is exposed separately from the main Streamlit screen, reflecting the different ingestion model used by that part of the project.
Connecting analysis tools around one workflow
Pandas provides the shared data layer, with NumPy supporting the calculations. Plotly and Matplotlib handle charting, and streamlit-agraph renders the EVM address graph. Neo4j serves the Bitcoin graph path, with Docker configuration included alongside that service.
The project’s strength is the way those tools connect: retrieve wallet activity, normalize the response, filter it, compare the patterns, and trace the relationships. The interface gives each stage a visible place, letting the user move from a wallet address to a much more detailed picture of how that address interacts with the network.